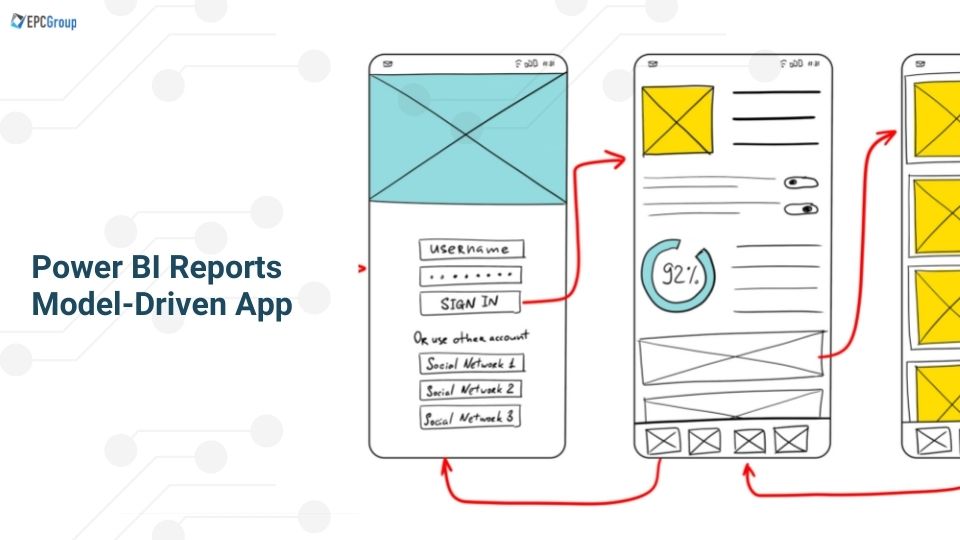
The term model-driven app refers to a designing approach that is focused on adding dashboards, forms, views, or charts to the organizational apps in action. The no-code or low-code tools can help the user organizations to build business apps that are simple or even complex.
In the canvas solution, the app creators have complete control over the application layouts. On the other hand, in model-driven apps, the majority of the layout is determined by the user interface components added to it. This implies that the emphasis in these apps is on viewing the organizational data and making quick decisions instead of the concept of building canvas applications. The user companies have a powerful way of using their business data within the Power Platform through Power BI Desktop or by using Power BI service, the included personal dashboards, and reports that help in refreshing data from model-driven apps.
Benefits of embedding Power BI Reports in Model-driven apps
Power BI is a powerful analysis and visualization tool within the Power Platform. The Power Apps portal is efficient in enabling users to take action through custom web applications or mobile devices. Power BI Dashboards and reports can be embedded into model-driven applications. This implies that the best features of both Power BI and model-driven applications can be achieved simultaneously.
The benefits of embedding Power BI Reports into the model-driven applications have a range of benefits which include the following:-
- The user company becomes capable of delivering a consistent customer experience through compelling data visualizations for the end-users. This improves the decision-making process based on the insights.
- The embedding of Power BI Reports within the PowerApps model-driven apps helps the user company to provide rich reporting and analytics capabilities to the host model-driven form. This empowers the users to accomplish more with the organizational data.
- Finally, the power of aggregating data across various systems can be achieved which can tailor the data into a single record.
Visit – Power BI Embedded Consulting
Understanding various aspects of Power BI:
The essential elements of the Power BI Service include the Workspaces, Dashboards, and Reports. Workspaces are built on capacities. In the technical sense, the term refers to containers that keep dashboards, reports, datasets, workbooks, data flows, and others in Power BI.

The term Report refers to one or more padded visualizations like charts, maps, and treemaps. All these visualizations in a report come from a single dataset. On the other hand, Dashboards are created in the Power BI Service and shared among individuals in the user company. These dashboards generally display the information that is essential for making effective decisions in an organizational framework.
Creating a Power BI quick report visualization in a model-driven app:
The user company can create a quick report visualization with Power BI within a model-driven application. To do this, a table has to be selected within the model-driven app, and to “visualize this view” has to be clicked from the command bar. This displays a dialogue box that shows an automatically generated report which contains a range of fields of predefined visualizations. The user can change the information in the report and can add or remove fields that need to be visualized from the data pane.
Locating the Power BI Workspace and report IDs:
The Workspace ID of the report ID is the ID of a specific workspace or report. This ID can be found in the form of the URL of the browser when the user selects a specific workspace. The process of locating the Power BI Workspace and reporting ID includes the following steps:-
- Click on the Workspace on the left menu on the Power BI site. Navigate to the App Workspace the ID of which is to be found.
- Click on the… ellipsis and select Members.
- Select this, the display takes the user to an Outlook site that contains the ID of the workspace as a part of the URL.
- At times, the Files and Conversations option also takes the user to pages where the ID can be extracted from the URL.
Contextual filtering for embedding Power BI Reports:
The term Contextual filtering implies the process of customizing the predefined visualizations or reports within the model-driven applications. The user company is provided with the capability to make the reports and tiles within Power BI more meaningful through the application of contextual filters. The use of these contextual filters converts the reports into the current model-driven form.
The contextual filtering leads to customizing the Power BI reports and tiles based on attributes of the current row. The user can create more complex filter expressions by understanding and providing appropriate values for $schema and filter type. One of the basic uses of this filtering method is to permit a single report to display contextualized information for all the rows of the table.

Limitations and issues in the process of embedding Power BI Reports and Tiles: A model-driven app perspective
There are certain issues and limitations in the process of embedding Power BI Reports and Tiles within the model-driven applications. The common issues include the fact that the group ID is not specified in the Title URL node of the control parameter where it usually should be. In addition to this, the fields have varied data typed in Power BI and Dataverse. But it is essential to be of a similar type, like a string in Power BI and a string in Dataverse. Finally, the string fields do not have escaped quotes in the Power BI filter.
In the context of limitations, the primary limitation is the fact that the integration of Power BI Reports into model-driven applications is available only in the Unified Interface client. Along with this, opening the embedded form in the Power Apps fork designer will not depict the control in a meaningful way. This is because the control is customized outside the app designer command bar.
One of the other limitations is the fact that the users are authenticated and given access to Power BI automatically with their Power Apps username and password. In a case a Power BI account with matching credentials does not exist, a prompt sign is displayed. In addition to this, the view of the report data displayed inside the Power Apps is similar to that in Power BI. This implies that the security roles and privileges do not affect the data that is displayed. Finally, if the form does not depict the Power BI Report even after importing the solution and publishing customizations, the user needs to open it in the model-driven form editor and save it.
EPC Group: Power BI Consulting Partner
The EPC Group is one of the leading Microsoft gold partner firms dealing with business intelligence, collaboration, and information management methods in the USA. Being focused on software integration processes within the stack of technologies within Microsoft, the company has been pioneering how user organizations analyze, collaborate, and tackle information.
The organization is adept at leveraging its expertise through real strategies that create a foundation for the solutions and services to be used by companies across the globe. In addition to this, the EPC Group is known for creating award-winning strategies that intend to harness the business needs of the user company to provide a complete and intuitive user experience.
With over 22 years of experience in database designing, business intelligence, ETL, analytics, and AI app solutions. The EPC group employs certified Power BI consultants who are experts in leveraging the Power BI features for the betterment of the user company. As a unique Power BI Consulting firm, the organization uses tailored methods to ensure that the user companies can embed dashboards and become highly functional.


