Data is the fuel that is spearheading the growth of modern organizations worldwide. With more and more advanced tools and requirements, the need for professionals with the knowledge of Microsoft Power BI and the Power Platform is on the rise.
The opportunities and capabilities with Power BI are endless, and you can dramatically grow your industry footprint by implementing critical insights that you learn from your data. In this extensive guide, you will get accustomed to almost everything around Power BI reports from beginning to the advanced levels. Keep reading and buckle up for the transition from novice to advanced visualization.
Understanding what exactly is a report
Before we jump into the technical details, let’s understand what exactly a Power BI reports is, and how does it differs from a standard report? Some of the significant differences are:
- Conventional reports are static and are limited with the methods of representation and the type of data that you can process
- Power BI reports, on the other hand, are interactive and engaging. There is no end to customization that can be done to the reports
- You can even instate filters in the report and engage with it in real-time by making changes and reading the results. This feature helps most of the companies to make predictions and make decisions based on data
What is the difference between a Power BI reports and dashboard?

When we say that the reports in Power BI are interactive, you must be thinking what is the difference between a report and a dashboard. These terms are often used to refer to similar things, however there are differences between them.
It is vital to understand this, let’s focus in on some of the main points:
- You can make any changes to a report whereas the dashboard remains fixed and you cannot make any changes
- The dashboard is a single page whereas a report can consist of any number of pages
- Dashboards can consist of any number of data sets, but the report is created based on one collection of data
- A dashboard is not available in the desktop version, but you can use the reports there
- You get the option to subscribe to reports which are not the case with the dashboard
- You can filter and bifurcate a report but cannot do the same in the dashboard
- The option to set alerts is available just with the reports
With that said, you might be asking yourself, why would I ever use a dashboard? There is still a good use-case for Dashboards versus reports. A Dashboard showcases the top priority elements from all your reports.
- Use a dashboard to display key performance indicators or insights for business owners or upper management to make decisions
- Dashboards can contain high visibility data for analyzing.
- Dashboards can be set as a favorite or a feature, reports cannot

If you are confused about all the terminology, you always have the option to choose Power BI support from professionals. You can get any questions/problems resolved from seasoned Power BI experts with years of hands-on experience.
What is a Power BI reports server?
Just like other platforms, Power BI hosts the report server. The reports server is on a web portal on which you can easily manage all your reports and excel files in one place. You can perform all the actions with your reports while managing and changing them.
You also get the option to ask for support in your reports from the Microsoft team.
How to create a report on Power BI
Creating a report on Power BI is more like creating an excel sheet. Microsoft has made sure to provide a user-friendly experience to everyone using the software. You can be from any background, and your needs can vary from analyzing your personal accounts to big Data, but Power BI has a solution for everyone. And, with proper training in Power BI you can create expert level reports in no time.
In this post, we will be starting from the very basics and help you understand the process. For better reports you can also learn best practices that comprise things to do before creating your first report.
Step 1 – The first step in creating a report is gathering data. You get many options to import data, and for this example, we will be starting with an excel sheet. Click on “Get Data” on the top and select the option of Excel to import your sheet.
Step 2 – Go to the Data view, and you will be able to make all the changes in your data. You can easily select and reshuffle columns and delete the unnecessary ones.
Step 3 – Next in line is the design of the report. While designing your report, you get a plethora of options to select from several charts, colors, details, etc. You will gain insights from your data which you can choose to integrate alongside your charts. Every part of these charts is customizable and helps you represent a core insight from your data.
Step 4 – Once you are done with the changes and designing, you can publish the report to the Power BI site from where you can easily share it with anyone.
How can I check my Power BI reports on mobile?

Taking convenience on another level, Microsoft provides all the data analysis features of Power BI from the mobile application. You can practically manage and control everything in your reports directly from the mobile app.
Let’s understand how you can check the same report you just created on your mobile phone. The process to view and access any report is using a QR code. You can generate QR codes for reports, even the ones for which you just have the viewing rights.
This QR code can be transferred on any device and platform and can then be used for access.
Creating a QR code
1 – Click on the ellipsis option on the upper right corner on your Power BI website.
2 – Among the options that you see, click on Generate QR code.
3 – Click on the download button to save the code.
You can now use this QR code to share it with anyone. Anyone with this code will be able to access the report directly from the mobile application.
Getting started with visualizations
Understanding and discussing all the visualizations options and techniques is beyond the scope of this post. We will be sharing the basic and the most commonly used visualization tools and techniques.
Furthermore, all the steps given in this post are more than enough to serve the advanced requirements of creating engaging and insightful reports. Although if you have custom requirements and advanced reports to be designed, you can always contact our Power BI support team for professional assistance.
In addition, to add visualizations to a report, click on the report view and you will be able to access all the customized panes and sections. All the sections allow you to create a specific part of your visualization; let’s understand the process.
- The visualization pane contains all the tools that you will need to create visualizations. All the icons on this panel can be dragged onto the display window and customized to your specific needs
- This pane is divided into three sections, namely, Fields, formats and analytics
- The fields section is used to apply datasets to your reports
- The formats section is there with all the options to format and change all the visualizations that you make
- The analytics section allows you to add dynamic reference lines to certain types of visualizations
The types of Visualizations that you can create with these options
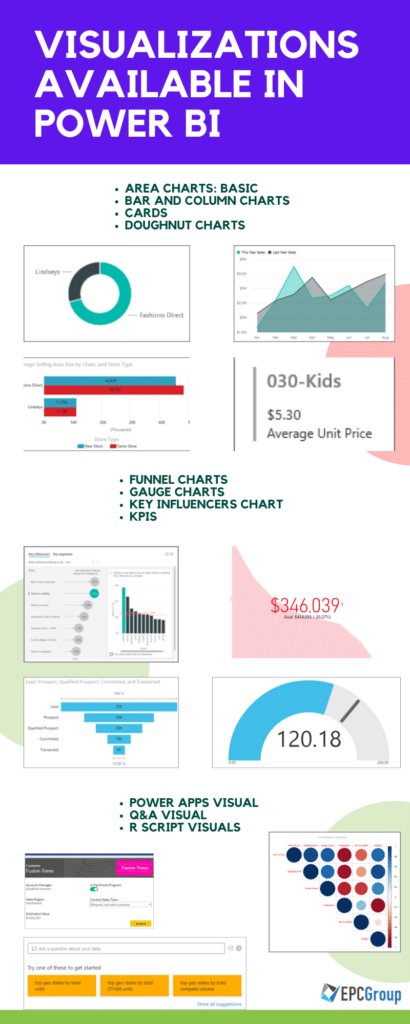
There is no limit to the complexities and visualizations that you can add to your reports. In the beginning, these are some of the visualizations that you should try. We have selected the most popular and useful visualizations that are currently being used:
- Matrix visuals
- Table and card visuals
- Pie and Do-nut charts
- Tree-map charts
- Clustered Column charts
- Filled Map
All the mentioned types in the above list can be used with a single click. You can quickly start by choosing the appropriate option in the pane and start by making specific changes.
Returning to the basics
Many evident and necessary things must be followed while creating reports. You get to learn professionalism in every business after gathering years of experience. The same is the case with Power BI, but to help you avoid the basic mistakes and create reports like how Power BI consulting companies, we have created this checklist of points to keep handy while preparing every report.
1. Integrating images and specifically your company logo
On the upper panel of Power BI, you will be able to see the image icon which enables you to integrate images in your report. Apart from the graphics that you create, you must insert a few images in your report.
This increases the engagement level of users as well as relevancy. Additionally, make it a rule of thumb to start with integrating the company logo, preferably on the upper left corner. This will help you to create a color theme for your report, which will be in line with the color theme of the logo.
2. Creating dividing lines
Aesthetics is part of every effective report. Initially, users tend to ignore dividing content on reports which is the first thing you should avoid.
Use the shape button in Power BI to create dividing lines that will separate the content, and a pro tip is to use complementary colors.
3. Make sure to integrate dates to your reports
The reports you create today will be analyzed for a long time, and soon, you will realize that you have created a lot of reports with varied data. You will also start getting questions from your team about the date of the data processing.
A quick hack to manage everything is integrating a date stamp on each of your reports. This can be done using various methods and feel free to choose one for your convenience.
4. Using layouts for the visual appeal
Layouts are an effective way to maintain the aesthetic look and feel of your reports. You have the freedom to create layouts in PowerPoint or use the innumerable free layouts.
Choosing a layout for your report well in advance will help you to manage and divide the space of your report.
5. Using best color combinations
This is a fundamental approach, but if you are not from a designing background, you will probably make this mistake.
Always make sure to use complementary colors in your report. Humans are attracted to complementary colors, and using similar colors will make your report look dull.
6. Using the power of icons
Icons are yet another feature in Power BI that can help you hold the attention of the end-user. Power BI offers numerous icons representing almost everything that you can need in a report.
You can start quickly by clicking on your visual and selecting the paint roller option in the pane. Under the section of conditional visualization, you will find the option to toggle the choice of icons.
Clicking on advanced controls will allow you to control the properties of the icons. You get a lot of options, and you can also download custom icons from third party sources for your convenience.
Tips for increasing your efficiency and creating the best reports

Although Power BI gives the most efficient and user-friendly platform to analyze your data, there are many things that people often do it wrong. To make sure that you have the best experience and create reports which help you make changes in your business, we have created a list of the things to follow before you start your journey.
These steps and guidelines will help you prevent some obvious mistakes which are done by every new user of Power BI. Without any further ado, let jump right into the list:
1. Keeping it simple
Everyone gets lured by all the fancy visualizations while making the first report. You will be getting hundreds of options to complicate your report but always make sure to keep everything simple. The purpose of the report is to provide insights that will bring out changes in your company.
Using line and bar charts are always more efficient and effective than using tree-maps for visualizations.
Some of the hacks for increased effectiveness are:
- If you have two data sets to represent, the best option is the combination of a bar chart and a line chart
- Horizontal bar charts are the best to compare rankings in data
- Humans have a tendency to check data starting from the top left section of the report; this is your cue to add the most critical data in the top left
2. Creating relations to make your reports interactive
The interactive ability of your reports can actually improve your comprehension multiple times. Every report that you create will probably have many sets of data in which each set will have its significance.
Let’s assume you have three sets of data, and for these sets, you have created four different types of charts. Power BI allows you to develop relations between all sets of data using which you can click on one data set, and the report will highlight just that set in all the charts.
This helps you to analyze every data set and help you visualize the insights that you have gathered.
There are three types of interactions in Power BI:
- The first type is no filtering in which you create no relation between all the data sets
- The other type of interaction is a highlight. Highlight in the case of bar charts will allow you to click on one bar and it will highlight specific data set in all the charts
- Another type is the actual filtered value. It is used to check the values hidden behind a data set without the relation. In this interaction, clicking on a bar filters the others and displays data specific to that data set
3. Use of filters in the reports
Filters are part of all data analysis and processing software, but the amount and types of filters in Power BI are more advanced than any other software. Moreover, we will be discussing all the types and the details so that you can use them as leverage in your reports.
The basic types are:
- Visual level filters are available to filter the data based on the colors and background of your report. If you have some data sets hidden because of the color combinations, you can use this filter
- Page levels filters allow you to filter all the elements on a page broadly
- Report level filters are used to filter data in all of your reports at the same time. After enabling this filter, it will automatically be applied to all the pages in your report, and you will have the data highlighted or other filters done when you turn every page
4. The effective use of hierarchies
Every report in an organization is used and analyzed by different members of the management. Some data in your reports will be significant for a specific department while some will be significant in the other. To help you keep the interests of all the departments in line, Power BI gives you the option of hierarchies which is one of the effective ways to manage data.
The three types of hierarchies available in Power BI are:
- You can use a data source as a hierarchy
- Hierarchy can be based on date and time-date data. This is especially useful for departments which are more concerned with analyzing weekly progress compared to quarterly growth in some cases
- You have the option to integrate more than one dimension in your reports
Power BI case Studies
| 1 | Challenges Facing the City of Weston |
| 2 | Challenges Facing Tesla |
| 3 | Challenges Facing Southern Farm Bureau |
| 4 | Challenges Facing Samsung |
| 5 | Challenges Facing Nampa School District: |
| 6 | Challenges Facing Haskell: |


