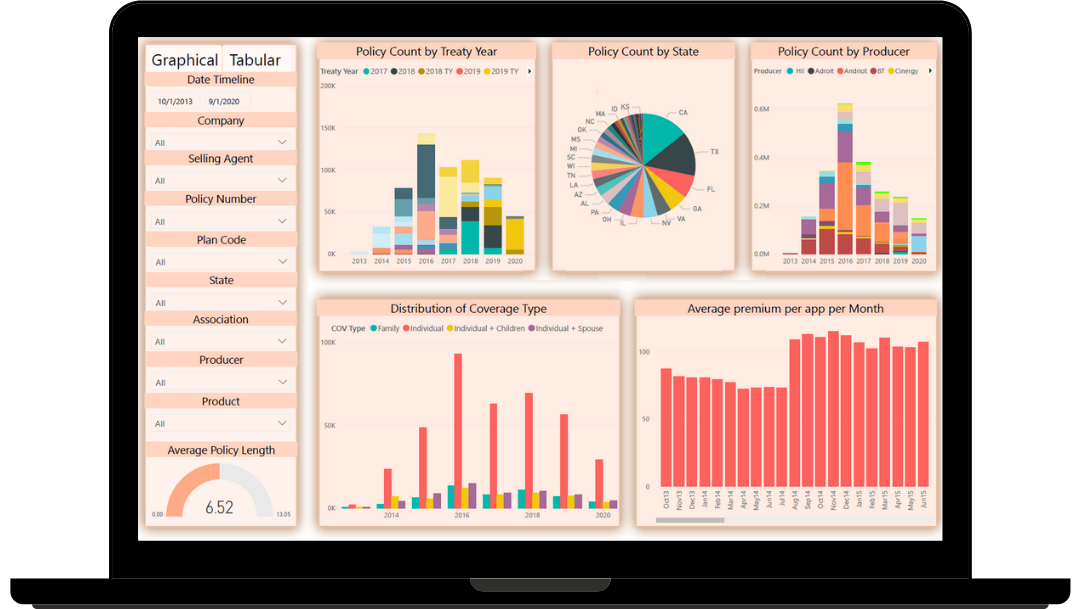
A power BI report provides a clear insight from a dataset to you. Unlike excel, here data is presented in rows and columns instantly. But do you have any idea on which section of Power BI a report is created? Well, let’s discuss in detail the same.
Power BI reports explain your dataset in a better way. The report is presented in pages of different visualizations of your business. These visuals can further be put on the dashboard.
What Are The Procedures For Knowing The Section Of Power BI For Creating A Report?
- For a report to be made you have to first go through the making of a dataset, along with a blank report canvas.
- After you are done with your dataset go to the option of ‘datasets’, which you will see in your workspace.
- Click on the ‘create report’ icon over there.
This is the major section that will be used for creating a report. As you will go further with the steps you will enter into the report builder section. There you will find further three options, which are namely- Visualizations Pane, Fields Pane, and Canvas.

- Visualisation-Visualizations pane is the section where you will be able to edit your visualizations or can further modify them up to your needs and requirements. The modification and editing will include the format or the option for all the values of the Power BI visuals you have provided/added.
- Fields-Fields plane will include the fields of your dataset or instead, you can also call it columns of your dataset.
- Canvas-Canvas is quite commonly known as the empty white space for you to make all your visuals presented in the center. It is the base of making your visuals.
What Are The Two Basic Options For Making The Report?
For making a report after this you should either select the fields option and then go towards visualizations. Else, there is a second option where you can select the visual first if you have decided how your visualization is going to be and then go towards the fields option.
While using the first way you just have to select the details of the data you want to make visualizations for. After clicking all the fields required your visual will be created on the canvas.
Now, how to change the type of visualization for your data in the report? You can also change the visuals according to your needs and requirements. For this, you just have to go towards the visualization pane and click the type of visualization you want.
What Are The Ways To Modify Your Power BI Report?
You can edit your report however you want. Power BI enables you to freely make any changes through your visualizations. Not only the visuals but you can also edit your texts up to your choices and requirements.

You can go to the ‘format’ options to change the formation of your made visuals.
How To Save The Power Bi Report?
There are very simple ways to save your Power BI report.
- You just have to click the ‘file’ option and select ‘save’ from the dropdown menu.
- As you click on save you will be asked for the name of your report and save it finally.
- Thereafter you will be informed about your report to be saved.
Conclusion According to Power BI Consulting Experts, making a Power BI report is extremely easy and takes efficient considerations as without them you will not be able to make dashboards, as reports are the base of visuals. If there are no reports then there will be no visuals further being no dashboards


